If your business has to adhere to compliance rules for a framework like FedRAMP, CMMC, or ISO 27001, keeping track of all of the proof of implementation and artifacts is a full-time job. From individual security controls to overall framework compliance to ISMS implementation to stakeholder assignments, it can very easily be a cluttered, disconnected mess.
Being able to see it all at a glance can feel like an unattainable dream. Being able to see it all at a glance, with framework-specific analytics and overall insights, sounds impossible.
We've made that dream a reality.
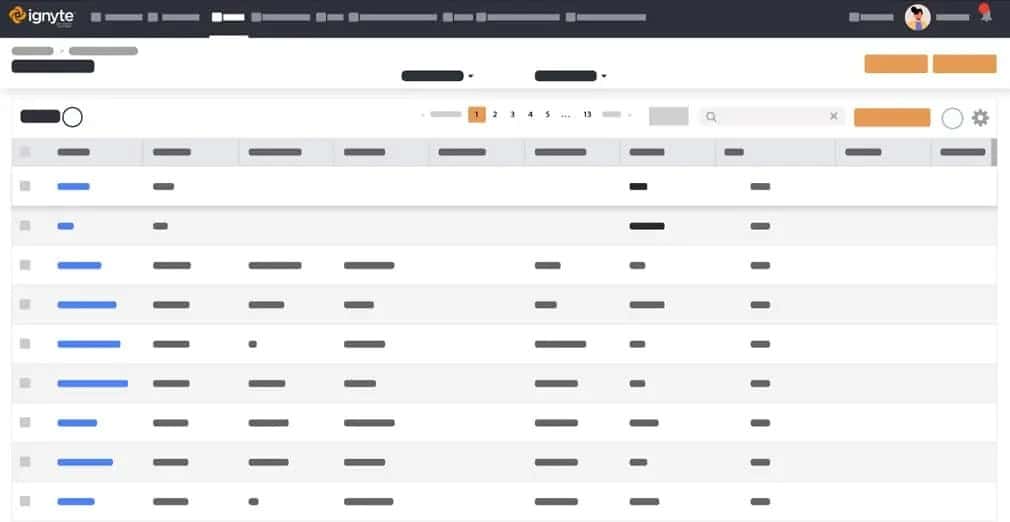
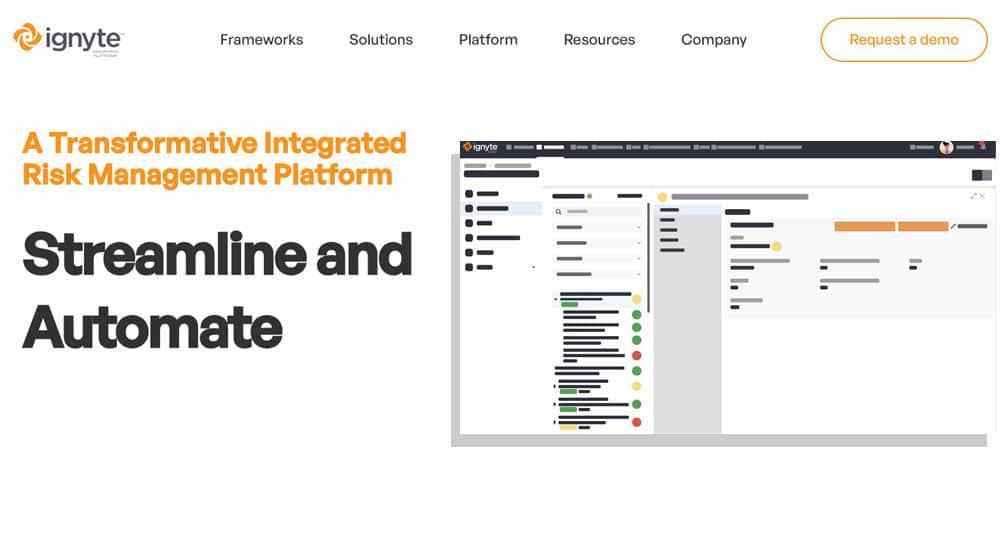
At Ignyte, we've worked in collaboration with the Air Force to develop the Ignyte Assurance Platform, a centralized, non-siloed way to view the complete picture of your company's compliance and security posture at a glance. From a bird's-eye view to specific evidence and individual controls, you can see it all in one place.
Today, we're giving you a direct look at the dashboard of the Ignyte Assurance Platform, without the need to schedule a direct demo with us. If, when you're done, you still have questions or want to see how it looks up close and personal, you can schedule that demo quickly and easily here.
 BLUF - Bottom Line Up Front
 BLUF - Bottom Line Up Front
Businesses adhering to frameworks like FedRAMP, CMMC, or ISO 27001 require streamlined compliance management. The Ignyte Assurance Platform centralizes compliance-related data, offering customizable dashboards for real-time insights across controls and assets. Widgets in the platform provide visual data representations for easier analysis, covering deficiencies, system statuses, vendor risks, and more. This centralized, adaptive platform enhances efficiency by allowing users to tailor dashboards to their specific compliance needs, fostering progress and addressing regulatory changes effectively.
The Goal of the Ignyte Platform Dashboard
In developing our Ignyte Assurance Platform, we've worked directly with both companies in need of compliance tools and with governmental sponsor agencies that have to work with the companies on the other end.
We put together the dashboard to meet the needs of the businesses that use it.
- It empowers your team to make>It helps you identify problems when they come up and respond quickly and appropriately.
- It adapts alongside you when the regulatory environment changes, such as the transition to CMMC 2.0.
It's not just about generalized data, either. You have specific information, from user counts to active systems, displayed according to your needs. The dashboard is completely customizable, so you can guarantee it shows the information you need, and doesn't crowd it out with noise you don't.

It's also not just one dashboard. The platform allows you to create multiple dashboards for different purposes and assign them to specific teams. Need a deficiency dashboard for the team solving problems? How about an evidence dashboard for the team compiling documentation? Every team member can have a dashboard customized to suit their specific needs.
This also applies to different frameworks. After all, you're not limited to just one. Plenty of companies adhere to both FedRAMP and CMMC, or to CMMC and ISO 27001, or to NIST directly via DFARS clauses.
Beyond Data to Analytics
In our experience, one of the biggest flaws of compliance tools is their preference for showing data directly. Direct data is important, of course, but there's more to compliance than a list of checkboxes and filled-out forms. You need insights into what the data means.
That's where our widgets come in. The Ignyte Platform is full of widgets that can be added and displayed to take underlying data and give you tangible, actionable insights about what it all means for your overall compliance posture.
Our widgets are also specifically designed to be color-coded visual representations of the underlying data. Not only are they excellent for an at-a-glance understanding of your compliance, they're also directly usable as elements of a report you give to your stakeholders and leadership. You aren't forced to create new charts and graphs to give to your board of directors; you can just copy a widget we've already set up for you.
Widgets for Every Piece of Data
Widgets for unique data displays are the core of the deep, powerful functionality of the Ignyte Assurance Platform. Those widgets come in different forms for different purposes, and fall into certain general categories. When you're configuring a new dashboard, knowing where to find the kind of widget you want is important. Obviously, you don't need to memorize all of this here (our documentation will help, and you can always ask us directly), but for an overview, here are the categories and what they contain.
System Widgets
System widgets are widgets that are integrated with the overall compliance module. They're where you find your top-level visualizations, like pie charts, graphs, and the matrix view of your security control compliance.
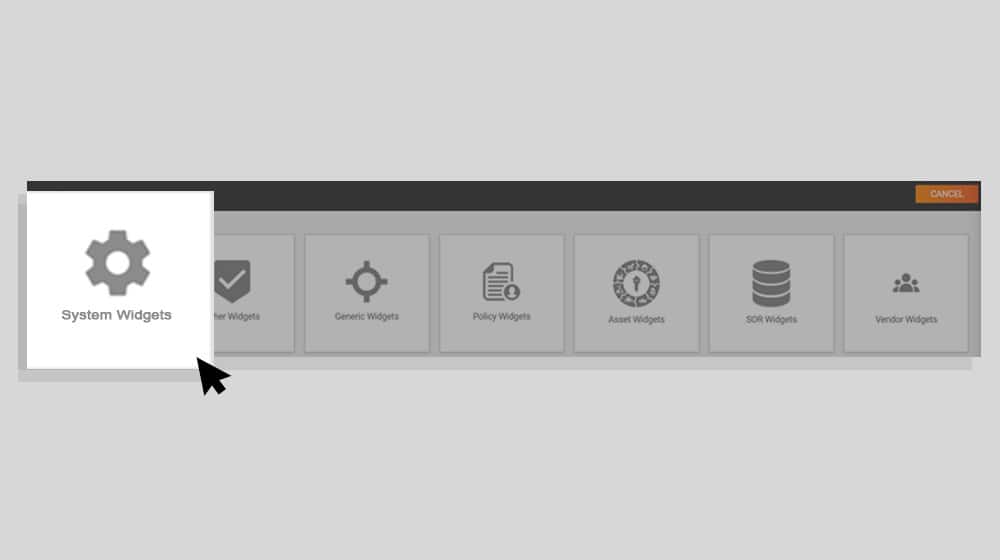
When you want a widget that gives you an at-a-glance insight into what your next steps should be in implementation, a system widget is where you'll find it.
Other Widgets
This catch-all category contains the foundational widgets you find on the default dashboards. Some of these are among the first widgets we created, while others are made for deeper but narrower purposes and don't fall cleanly into another category.
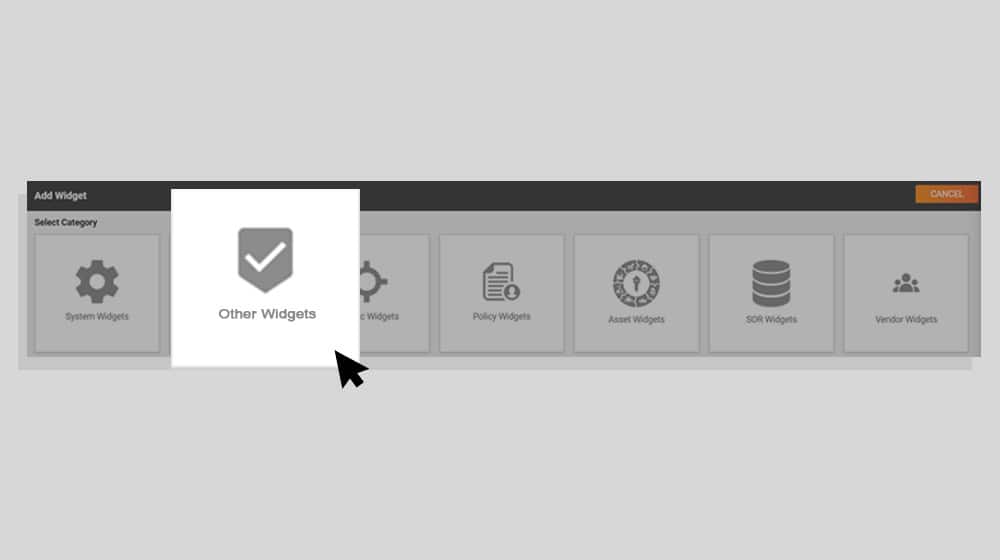
Don't let the category fool you; these are some of the most directly useful widgets in the platform. If you want an immediate report of your most critical metrics or operational status, here's where you find it.
Generic Widgets
The generic widgets are your top-level, framework-agnostic reporting tools. Key performance indicators, system completion rates, and visual displays of overall compliance; these widgets show you where you are in the overall process, and where you may need to direct some additional attention.
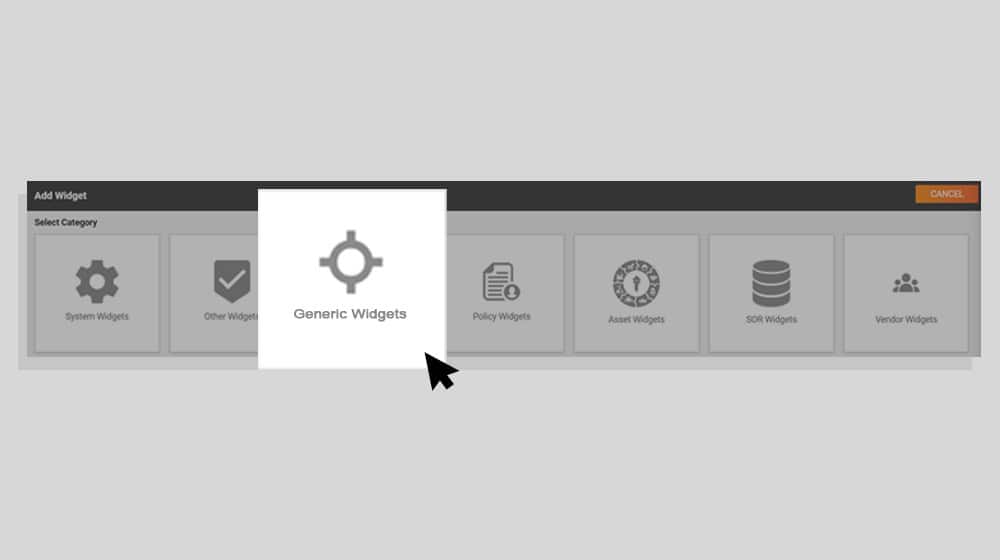
While it can be generic to the point of uselessness, a widget that simply tells you what percent of the way you are towards compliance is a nice piece of data to watch for morale and a tangible sense of progress, and that's one minor example of the widgets we have on offer.
Other generic widgets provide timelines and milestones for completion of certain goals within your implementation, giving you easy benchmarks to monitor progress throughout the process.
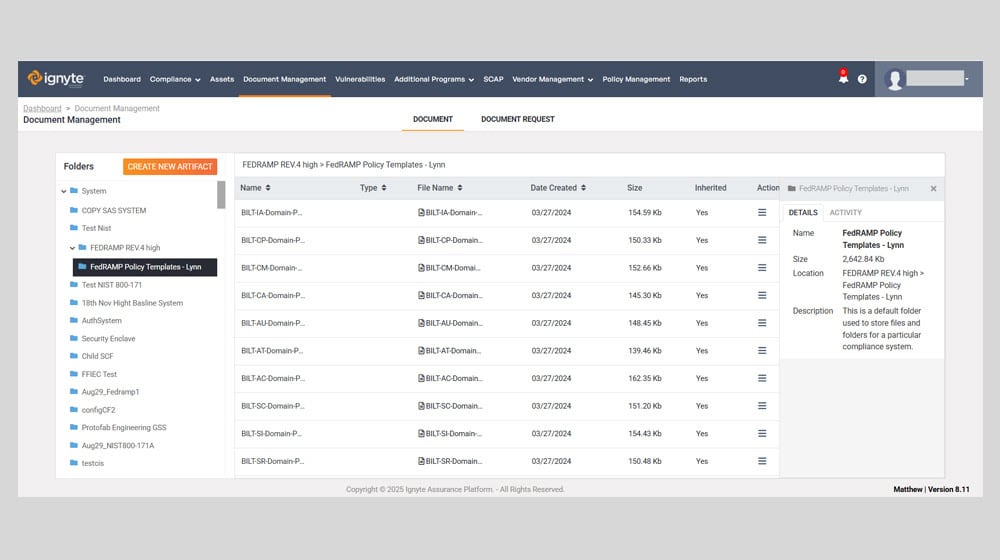
Policy Widgets
Part of compliance with most modern frameworks is a compilation and analysis of your overall company policies and the documentation related to them. Policy widgets are a visual overview of your policies and their documents, as added to the platform's data storage.
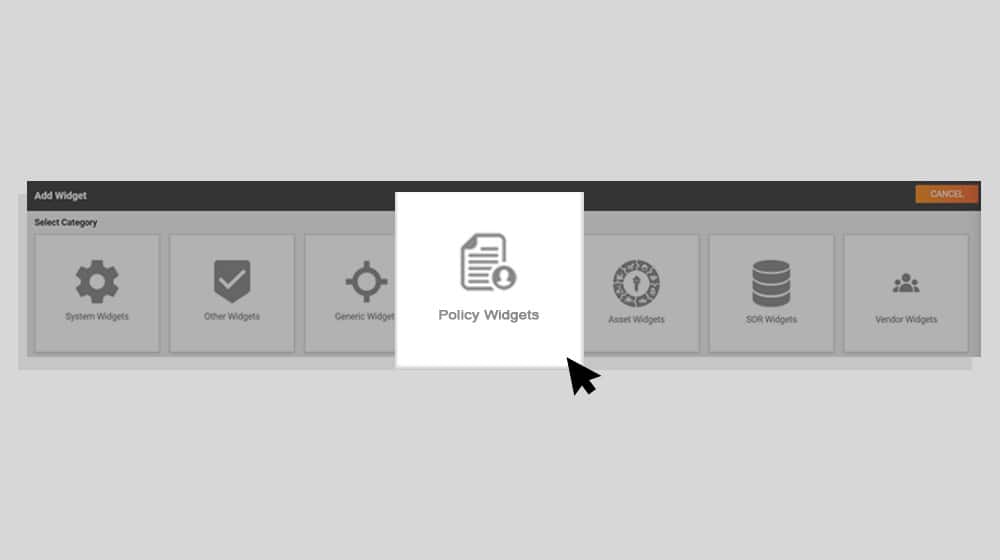
They can show you at a glance if you're missing any critical documentation, if your policies are potentially out of date, and if they're in accordance with regulatory expectations or internal needs.
Asset Widgets
A key part of compliance with a security framework is laying the groundwork through appropriate scoping. Scoping helps you identify which elements of your business, and which physical and digital assets, need to be secured. More importantly, it helps you exclude those that don't need the same level of security, so you're not doing more work to secure a larger threat surface than you need to.
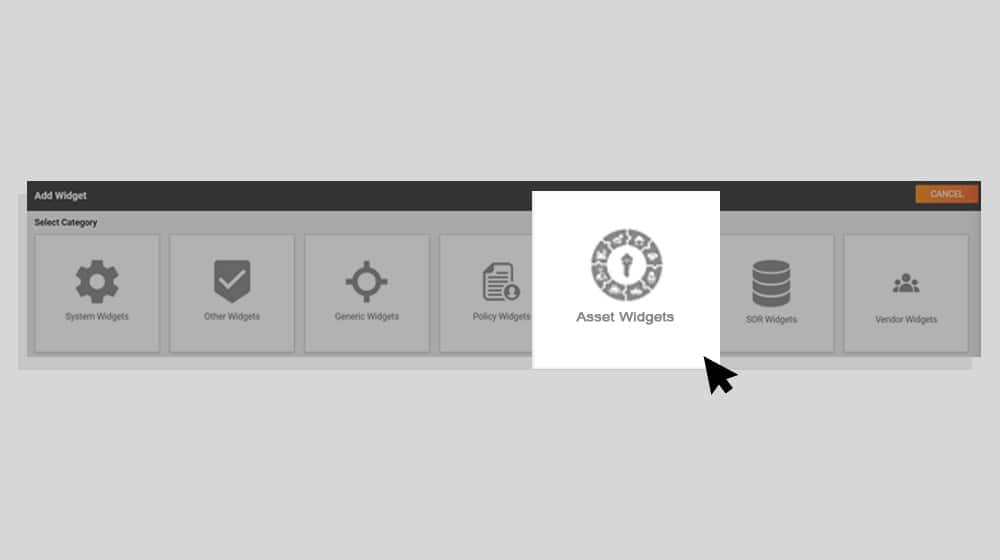
The asset widget class is a set of widgets that can show you insight into the assets you have registered to the Ignyte Platform. Individual assets can be tagged by impact level, location, CI type, distribution, department, and more. The widgets can then show you information and insights into assets based on those dimensions. Want to check the status of all level two assets at a glance? There's a widget for that.
Systems of Record Widgets
SOR widgets are interactive widgets that offer a detailed breakdown of systems registered with the platform. They allow top-level visualization with the option to drill down to look at specific systems directly.
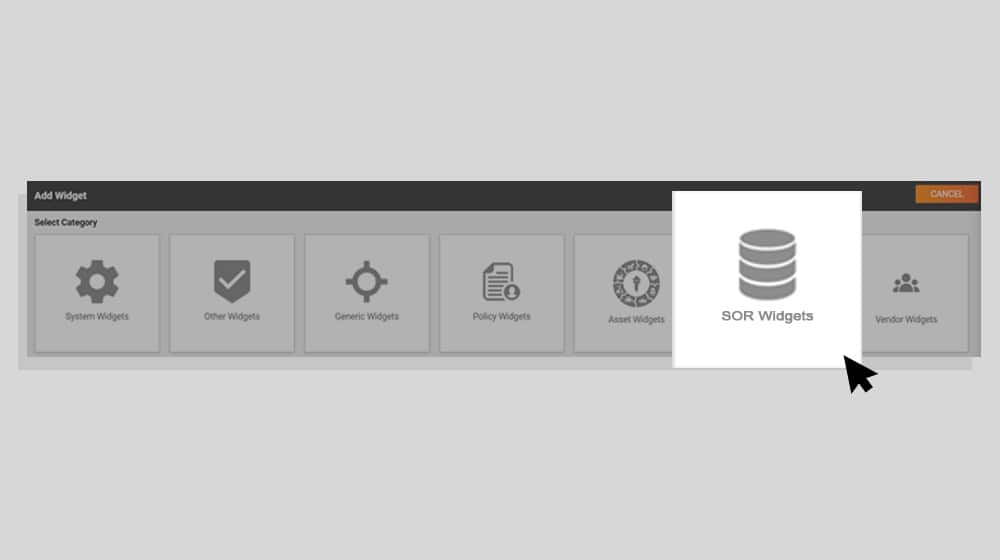
You can see different systems of record across different categories, look at their individual compliance footprints, and trace data ownership and risk across different systems.
Vendor Widgets
While some businesses operate on their own, many others have to work with vendors, and those vendors present their own risks and compliance challenges. The vendor widget category offers insight into third-party risks and management, with everything from calendars of assessments to vendor issue reporting and vendor analytics.
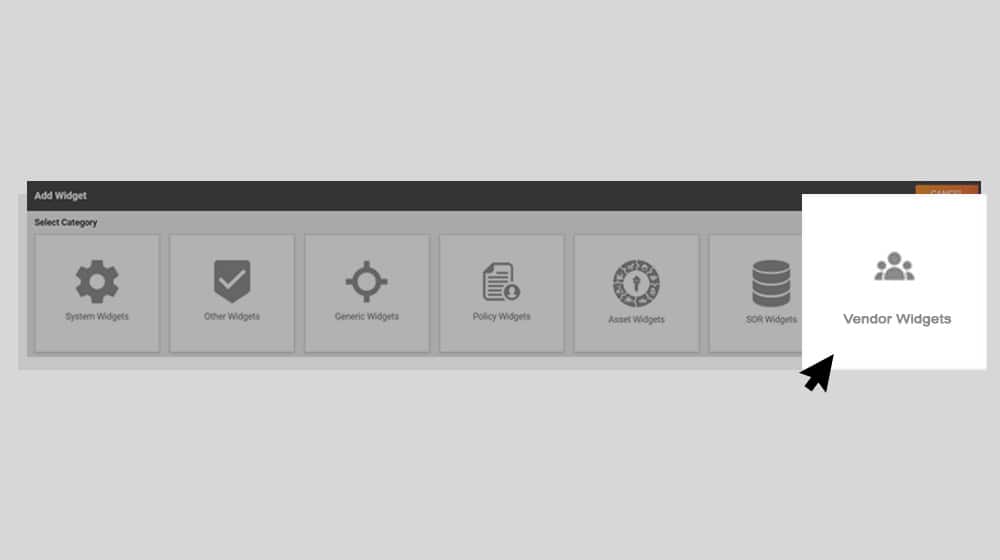
If your business is responsible for the compliance flowdown to vendors, these widgets help you keep track of it all in one place.
Exploring the Widget Library
"We have a widget for that" may be true, but it can be difficult to visualize. So, let's take a look at some specific examples of widgets within the Ignyte Assurance Platform and what they can do for you.
The Deficiencies Widget
The Deficiencies widget is a real-time reported number of documented weaknesses in your existing systems and their compliance, according to the framework module you're using. It serves both as a notice of deficiencies you can use to drill down and identify weaknesses, and as a feedback mechanism to show you when you've fixed problems with your compliance.
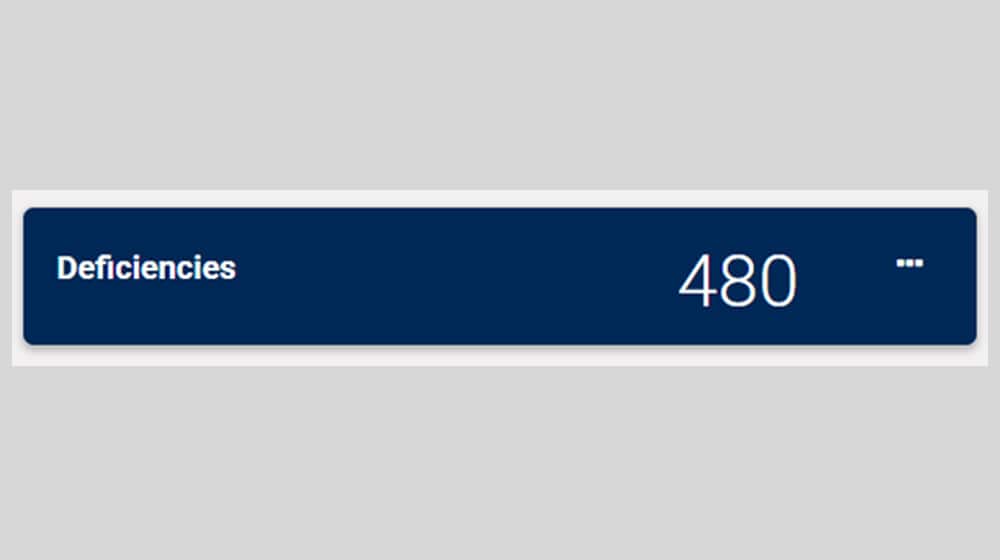
Because the widget updates in real time, it can inform team members and stakeholders when an issue is emerging, and helps prioritize remediation for the deficiencies that have the greatest impact. This one widget alone provides data that other compliance platforms dedicate entire tools to.
The Stacked Bar Chart Widget
A somewhat more complex widget, the stacked bar chart widget shows you the status of different aspects of compliance across different systems and categories. Each category is a family of security controls, each color represents a status for elements within that category, and the visual format allows for easy recognition of deficiencies (or successful implementation, for all-green bars).
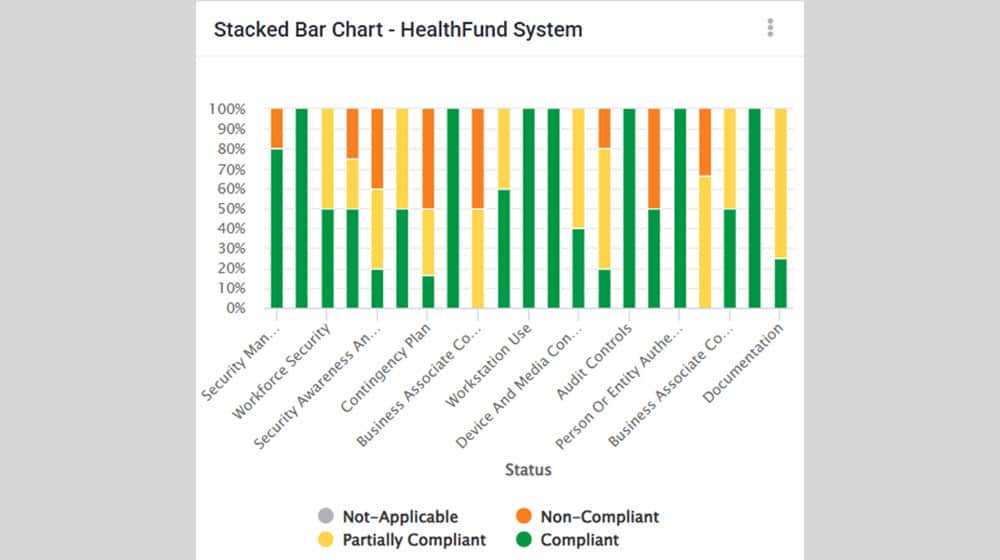
Not only does this allow you to see and prioritize the control families that need the most work, but it can also help you identify trends and patterns in the gaps in your compliance and potentially track them down to root causes, if necessary.
The Control Matrix Widget
Each security framework is based on a list of security control families for different categories of security. Each control family is broken down into specific controls, with their own individual designations, ideal implementations, requirements, and guidance. This pattern holds true across different frameworks, though the specific controls and families vary.
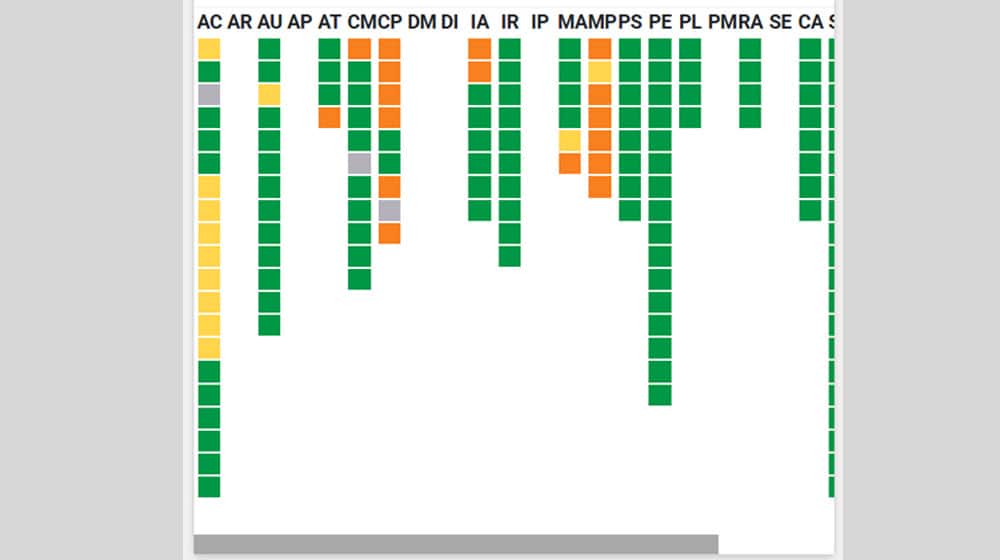
The Control Matrix widget is a visual display of each of the control families, and each control within those families, with their color-coded status. It translates something massively complex like NIST SP 800-53 into an easily understandable chart. It's yet another way to see gaps in implementation at a glance and identify patterns of deficiency to address them at the source.
The POA&Ms by Status Widget
A relatively simple widget, this chart helps you track the progress of any Plans of Action and Milestones you need to complete to maintain or achieve compliance.
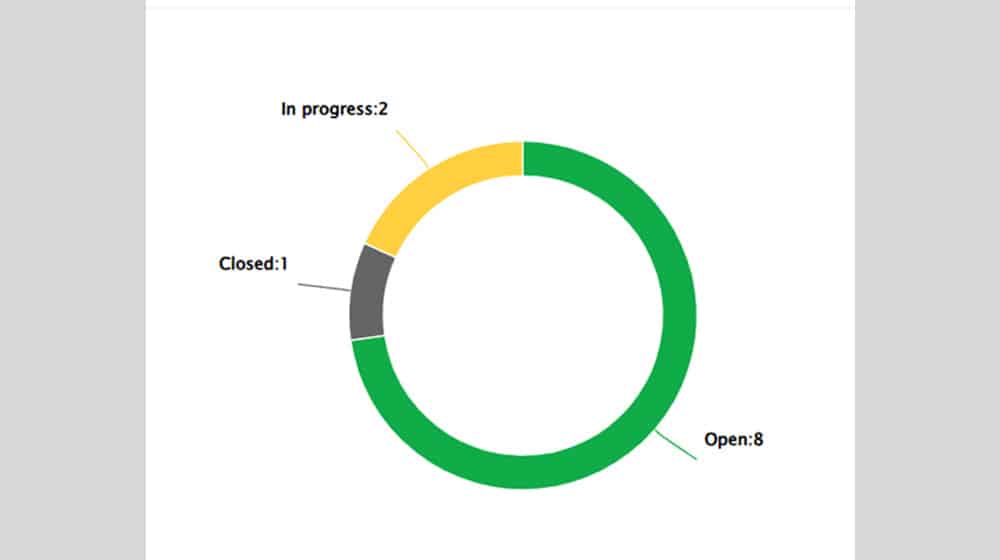
POA&Ms are a critical part of the compliance process, and nearly every business will need to use them at some point. Tracking them – when they're open, when they're in progress, and when they're successfully closed – is a key part of the POA&M lifecycle. It may not be a piece of data you use all the time, but when you need it, it's there for you.
The 10 Most Deficient Controls Widget
Staring down a complex compliance process is daunting, and it can often be difficult to figure out where to even begin.
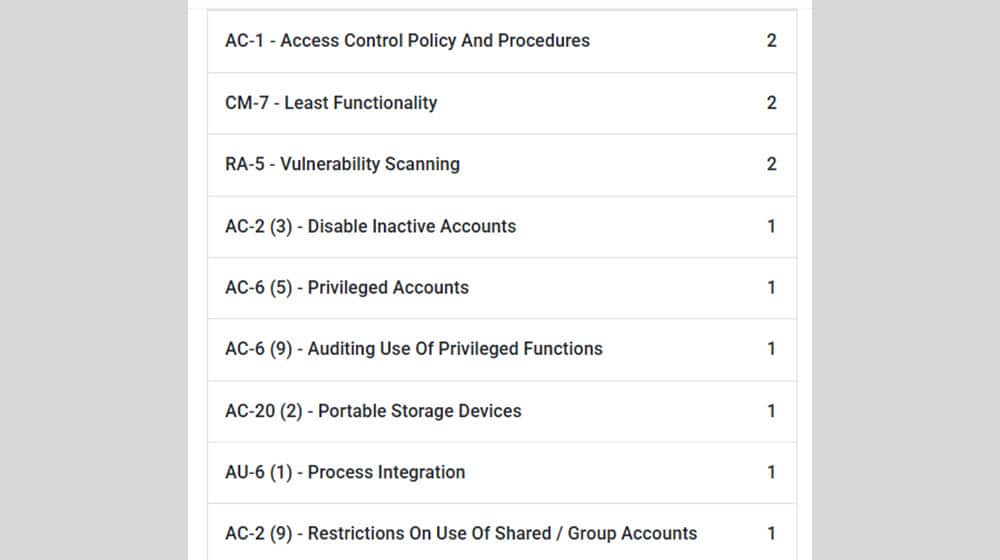
This widget, as the name implies, is an easy list of the specific security controls that are most in need of attention. It may be controls that are furthest from successful implementation, or the controls with the greatest frequency of problems, or the most severe non-compliance problems. It can be configured with different priorities and gives you an easy view of where your efforts should be focused to have the maximum impact.
The System Completion Status Widget
Each specific system within your business has its own lifecycle and its own set of needs for full compliance. Knowing how far along each system is and being able to identify the systems furthest from completion is another critical piece of data for prioritization of assets, resources, and effort.
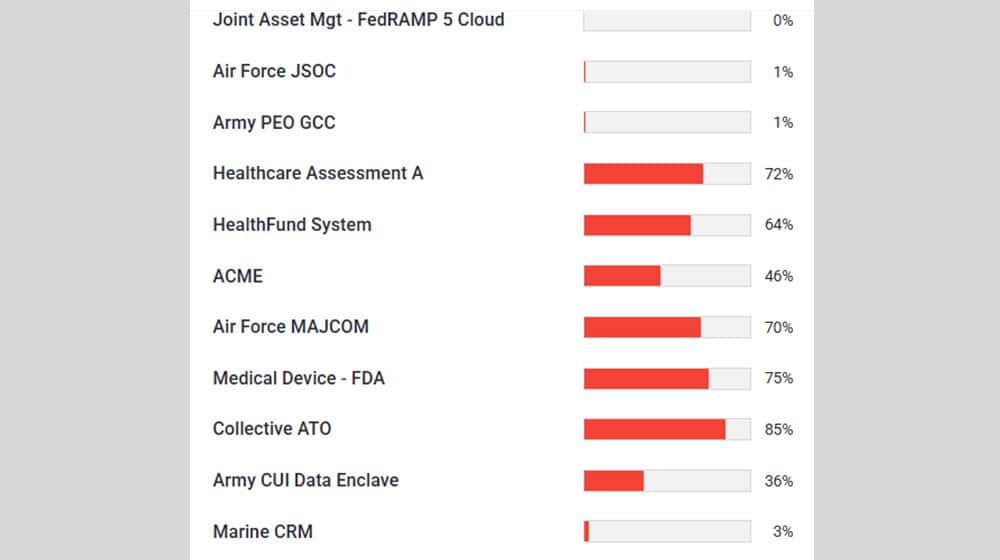
Whether you're managing a few dozen systems or a few hundred, being able to visualize their progress is invaluable. It can also serve as another feedback mechanism to showcase the progress made by effective teams or to identify the teams making the least progress and who need more attention. Seeing tangible progress on the dashboard also fosters momentum and morale in the team to keep the ball rolling.
The Control Status Bar Chart Widget
This is another simple, straightforward, yet surprisingly impactful visual display of information. When you have hundreds of security controls to monitor, an easy way to visualize their status is a powerful tool. This simple bar chart breaks down each control into Compliant, Partially Compliant, Non-Compliant, or Not-Applicable, and shows you the sum tallies for each.
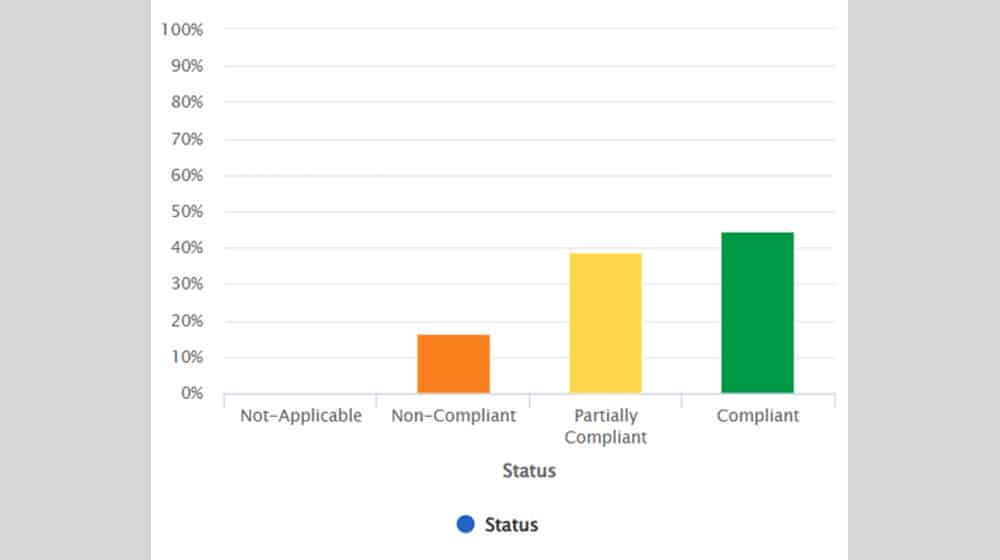
Watching your efforts be rewarded with more and more growth in the green bar is itself a kind of reward, and seeing spikes in another color clues you into issues that are rapidly arising and need your attention.
The Upcoming Assessments Calendar Widget
Let's be honest here; you already have a calendar tracking various appointments, meetings, and events. This widget serves two purposes. First, it provides you with a calendar that is focused solely on compliance meetings, assessments, and other important dates, free of the clutter of other business unrelated to compliance.
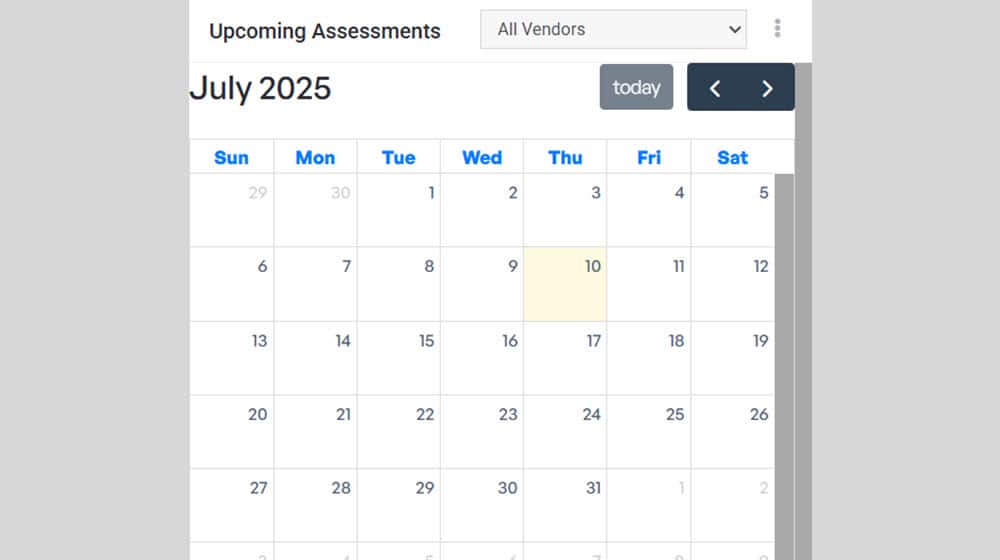
Second, it's accessible directly within the Ignyte Assurance Platform, so you don't have to tab over to other siloed calendar systems and cross-reference dates between teams. It's nothing unique, but it's specially positioned to be helpful for this specific purpose.
The Systems of Record Widget
The Systems of Record (SOR) widget is a visual breakdown of your company's data ecosystem. Each category of systems is given its own color and segment of the wheel, which allows you an at-a-glance way to see the distribution of different system categories throughout your business. It's possible, after all, that not all systems are equal in your business, and you may need to adjust the distribution of resources and attention to the largest or most critical systems.
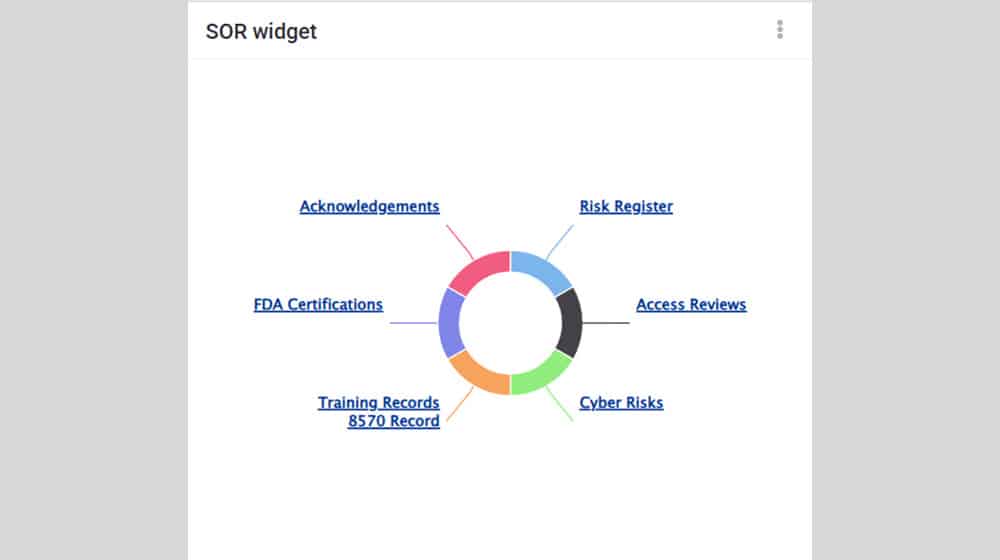
For smaller businesses, this might not seem like useful data. For much larger operations with hundreds or thousands of systems to track, having this kind of simple categorization breakdown is extremely valuable.
Dashboards in Action
Having one single dashboard to track something as complex as regulatory compliance is never going to work. There's simply too much information across too many different categories, demanding attention from too many different teams and individuals, for any one-size-fits-all dashboard to work.
That's what sets the Ignyte Assurance Platform apart. You can set up a top-level dashboard with birds-eye insights, sure, but you can also set up individualized dashboards for different kinds of tasks, like technical implementations, audit preparation, documentation and artifact gathering, and more. Each dashboard can be customized for an individual or team, tailored to their needs, with the relevant metrics displayed for easy accountability.
It's useful for everyone.
- Compliance officers can have a dashboard with real-time monitoring of control implementation, documentation, remediation, audit readiness, and more.
- Security teams can have a dashboard focused on security vulnerabilities, deficiencies, new issues, and developing threats, to enable rapid response.
- Vendor management groups can have a dashboard dedicated to vendor tracking, assessment monitoring, contract milestone tracking, and supply chain risk analysis.
Other compliance companies might offer these as stand-alone tools; the Ignyte Platform offers them all as customizable widgets within one centralized environment.
On top of everything, there's no restriction on adding more dashboards. That makes the Ignyte Platform ideal for businesses that grow and need to scale. Adding a new user with different needs? They can customize their dashboard. Adding a whole new team to tackle a new compliance area? Setting up dashboards is easy. The system adapts and evolves along with your needs, so it never chafes as you grow.
It can't be overstated how much a set of refined, useful dashboards can help streamline compliance efforts, as well. By ensuring dashboards are tailored to the needs of the people using them, you don't overload them with information they don't need, or train them to ignore sections of a dashboard as "not their domain". It maximizes efficiency, enhances speed and accuracy, and minimizes the chances of misinterpretation or misuse of data.
Getting Started with the Ignyte Assurance Platform
The Ignyte Platform is the result of dedicated work, design, and iteration in the field of compliance, using our partnerships with other businesses, our own experience as a C3PAO, and in achieving compliance ourselves, and in collaboration with the US Air Force. We know, first-hand, what is most necessary and what is most effective in ensuring compliance as smoothly as possible.
If you want to experience the power of the dashboards for yourself, simply book your demo today, and we'll show you how it works.

Dan Page is a seasoned Cybersecurity and Risk Management Executive known for advancing security programs aligned with complex regulatory frameworks and critical business objectives. With over 12 years in information security, his expertise began in the U.S. Army Signal Corps, where he led global communications and secured classified networks supporting Special Operations missions. Post-military, he specializes in security architecture for CUI, ITAR data, and federal cloud workloads. Currently, as Senior Cybersecurity Manager at Ignyte Assurance Platform, Dan guides organizations through compliance with CMMC, FedRAMP, ISO 27001, PCI, and NIST standards. A CISSP, CRISC, CISM, PMP, and ITIL-certified professional, he is also a cybersecurity lecturer and community volunteer advocating workforce development.